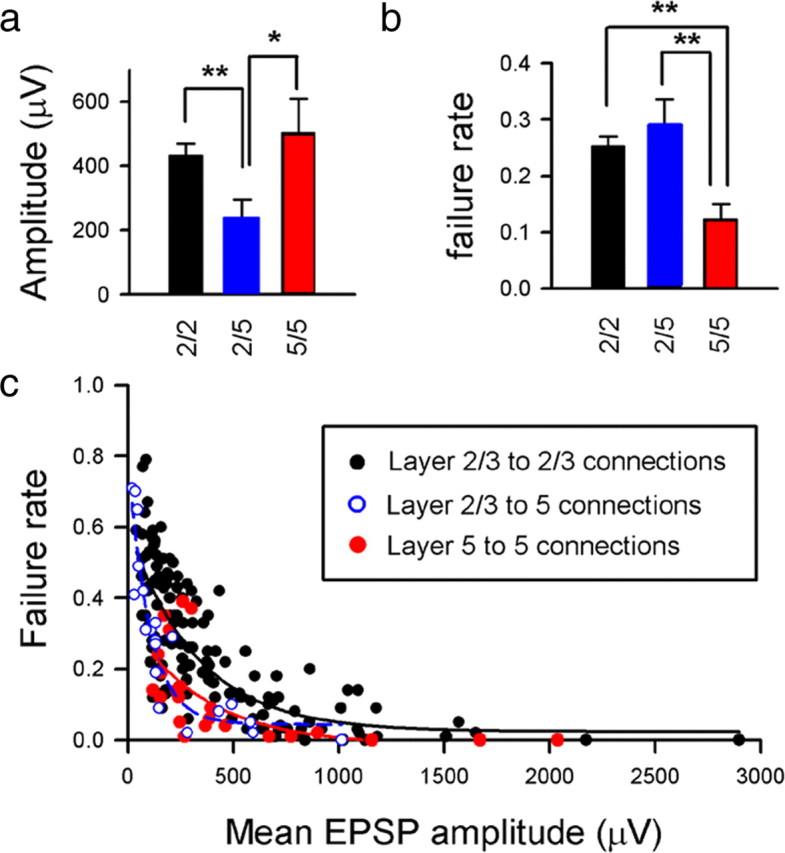
Figure 2.

Amplitude and reliability of EPSPs recorded in layer 2/3 and layer 5 pyramidal neurons. Comparisons of mean amplitudes (a) and mean failure rates (b) for populations of L2/3 to L2/3 connections (black), L2/3 to L5 connections (blue), and L5 to L5 connections (red). *p < 0.05, **p < 0.01, for paired comparisons. c, A scatter plot of mean EPSP amplitude plotted against transmission failure rate shows a similar correlation for L2/3 connections (black circles and hyperbolic fit line; r2 = 0.62, p < 0.001) to L2/3 inputs to L5 cells (blue/white circles and blue hyperbolic fit line; r2 = 0.85, p < 0.001) and L5 to L5 connections (red circles and hyperbolic fit line; r2 = 0.40, p < 0.01).
