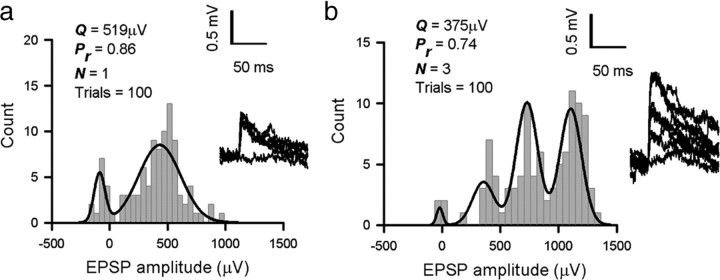
Figure 4.
Quantal analysis of layer 2/3 to layer 2/3 connections. a, Amplitude frequency histogram of a putative single release site connection, best-fit model (N = 1, Q = 519 μV, Pr = 0.86); inset, overlaid EPSP raw traces with direct current offset subtracted. b, Amplitude frequency histogram of a multi-release site connection, best-fit model (N = 3, Q = 375 μV, Pr = 0.74); inset, overlaid EPSP raw traces with direct current offset subtracted, drawn to same scale as a. Mean values of quantal amplitude for putative single release site L2/3 to L2/3 connections (n = 6, Q = 344 μV) and multi-release site L2/3 to L2/3 connections (n = 44, Q = 282 μV) were not different (comparison by paired t test, p > 0.05, not significant). Two of five L2/3 to L5 connections were single release site connections, as were one of the seven L5 to L5 connections.

