Figure 5.
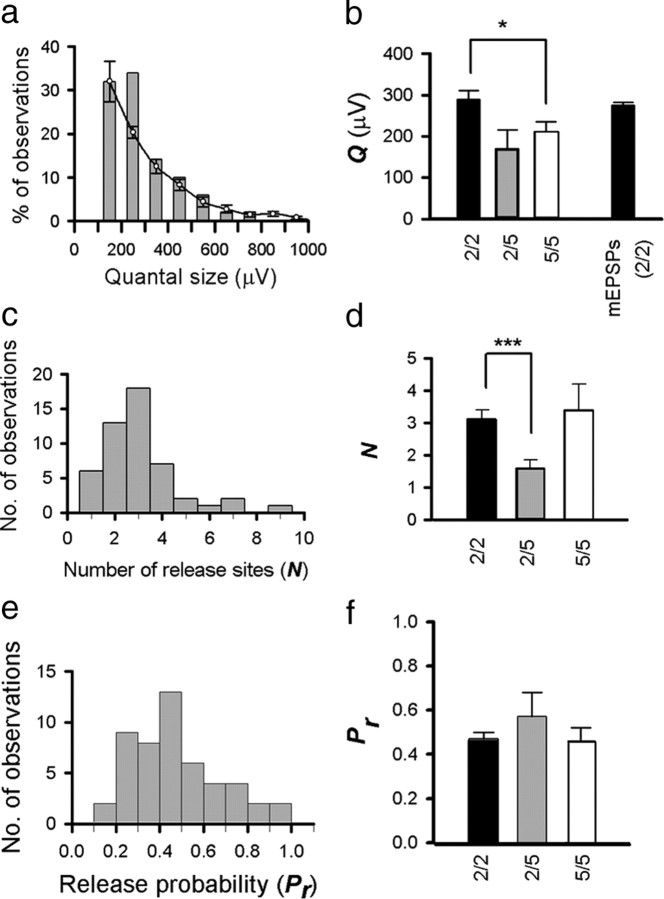
Synaptic parameters derived from quantal analysis. a, The distribution of quantal amplitudes derived from model fits (bars; mean amplitude of 289 ± 151 μV) is consistent (p > 0.05) with the relative distribution of mEPSP amplitudes from a population of four L2/3 neurons (lines with error bars; 500 recorded from each neuron, mean amplitude of 275 ± 163 μV). b, Mean values of quantal size for L2/3 to L2/3 connections (black), L2/3 to L5 connections (gray), and L5 to L5 connections (white). The black bar on the right is the mean amplitude of mEPSPs recorded from L2/3 neurons. c, The distribution of functional release sites (N) for L2/3 connections (mean of 3.1 ± 1.6). d, Mean values of N (number of functional release sites) for L2/3 to L2/3 connections (black), layer L2/3 to L5 connections (gray), and L5 to L5 connections (white). e, The distribution of Pr for L2/3 connections (mean of 0.47 ± 0.20). f, Mean values of Pr for L2/3 to L2/3 connections (black), L2/3 to L5 connections (gray), and L5 to L5 connections (white). *p < 0.05, ***p < 0.001 for paired comparisons.

