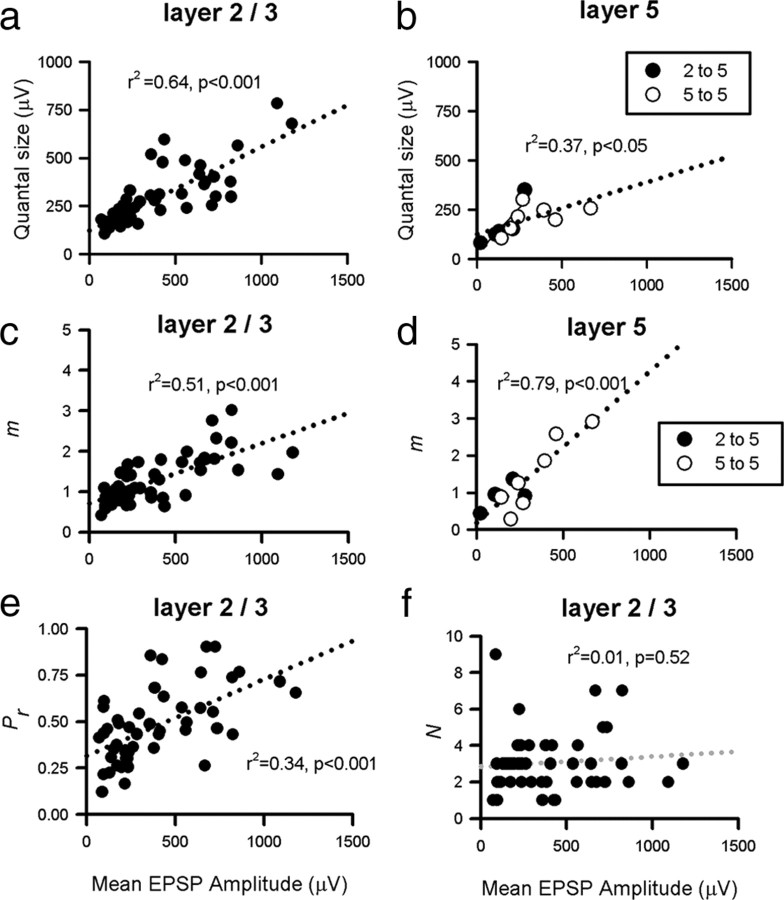
Figure 8.
Correlation between EPSP amplitude and presynaptic/postsynaptic efficacy. Correlation between mean somatic EPSP amplitude and somatic Q for L2/3 to L2/3 connections (a; n = 50, r2 = 0.64, p < 0.001) and inputs to L5 (b; n = 12, r2 = 0.37, p < 0.05). Correlation between mean EPSP amplitude and quantal content (m), a measure of presynaptic strength, for L2/3 to L2/3 connections (c; r2 = 0.51, p < 0.001) and inputs to layer 5 (d; r2 = 0.79, p < 0.001). The correlation in c for L2/3 to L2/3 pairs can be shown to be primarily attributable to release probability being strongly correlated with mean amplitude (e; r2 = 0.34, p < 0.001) with number of release sites uncorrelated with EPSP amplitude (f; r2 = 0.01, p > 0.05). Dotted lines represent linear fits.

