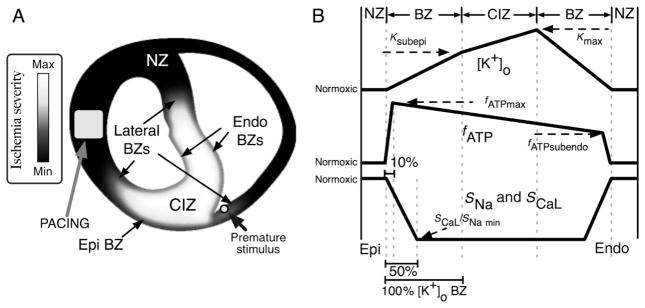
Figure 1.
(A) Distribution of ischaemic injury in the model, outlining the location of the ischaemic region (grey–white) and normal region (black). Electrode locations for pacing (square) and premature stimulation (circle) are marked. (B) Schematic profiles for the transmural distributions of [K+]o (top), fATP (middle), and SNa and SCaL (bottom). The horizontal axis indicates the transmural depth within the ventricular wall. The landmarks on this axis are, from left to right: epicardium (EPI, bottom left), epicardial normal zone (NZ), epicardial border zone (BZ), central ischaemic zone (CIZ), endocardial border zone (BZ), endocardial normal zone (NZ), and endocardium (ENDO, bottom right). The widths of the ‘BZ’ landmarks are based on the transmural distribution of [K+]o. Border zone widths for fATP and SCaL and SNa are shown as a percentage of [K+]o BZ width. The level of ischaemic injury is plotted on the vertical axes, from normal through the maximum level of injury for a given time post-occlusion.

