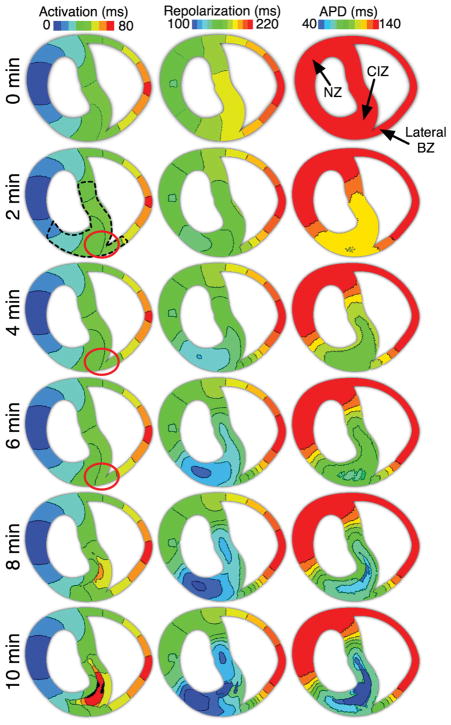
Figure 2.
Activation and repolarization isochronal maps as well as action potential duration maps from 0 through 10 min post-occlusion in the regionally ischaemic model. Isochrones are 10 ms/colour. Locations of site at which action potential duration and effective refractory period were recorded for Figure 3 are marked in the 0 min action potential duration map. Red circles indicate the locations at which a shift in the isochrones occurs due to changes in conduction velocity at 2–6 min post-occlusion.

