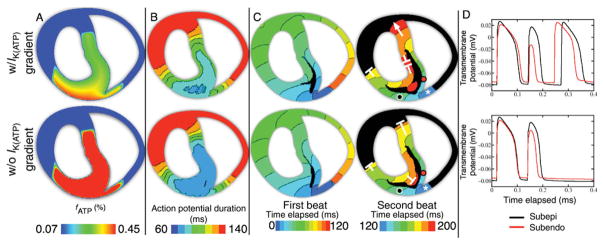
Figure 6.
Top row: regionally ischaemic model with transmural gradient of IK(ATP) activation. Bottom row: regionally ischaemic model without transmural gradient of IK(ATP) activation. Data are from 6 min post-occlusion. The five columns are, from left to right: fraction of activated IK(ATP) channels (fATP); action potential duration in the last paced beat prior to application of the premature stimulus; activation map of the first beat following the application of a premature stimulus at a coupling interval of 175 ms; activation map of the second beat; and action potential traces from the locations marked by black and red circles in the fourth column. All isochrones are of 10 ms spacing. In the activation maps, white asterisks mark the first isochrone in the second cycle of re-entry. White ‘T’s mark locations of wavefront propagation block, whereas white arrows indicate that the wavefront continued to propagate. Black areas were not activated during the mapped period.

