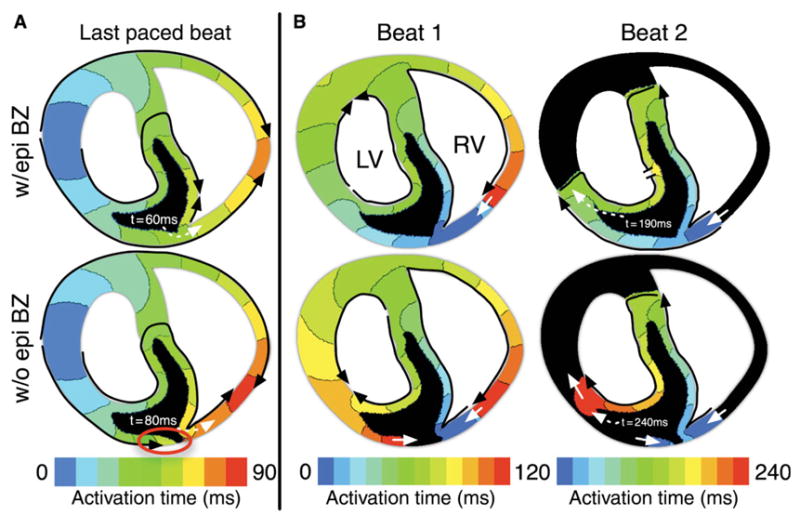
Figure 7.

(A) Activation maps for the last paced beat 10 min post-occlusion with (w/epi BZ) and without (w/o epi BZ) an epicardial border zone. Black arrows outline the conduction pathway. Activation time isochrones are in the range from 0 to 90 ms following the application of a pacing stimulus, 10 ms/colour. Black areas were not activated during the mapping period. Red circle indicates the site of conduction block. Dashed white arrows indicate the time at which the site of premature stimulation was activated by the paced wavefront. (B) Activation maps from the first and second reentrant beats (Beats 1 and 2) with and without an epicardial border zone. Activation isochrones range from 0 to 240 ms (120/beat) and are spaced at 10 ms/colour. Black areas were not activated during the mapped period. Solid white arrows indicate continued propagation from one beat to the next. Dashed white arrows indicate the time at which the wavefront reached the left ventricular lateral border zone in the second re-entrant beat. Flat line ends rather than arrowheads (Beat 2, left ventricular endocardium) indicate termination of wavefront propagation. Coupling interval is 190 ms in all maps.
