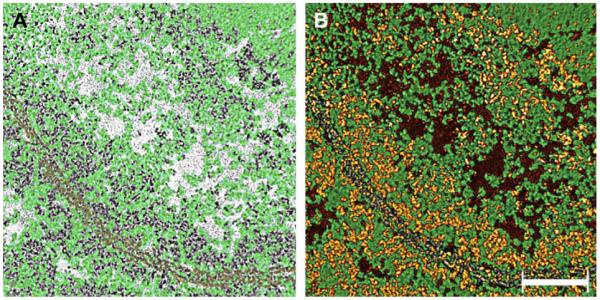
Fig. 2.

Density segmentation of the cytoplasm from unextracted lenses. Panel A shows the segmented density representing the cytoskeleton matrix (green) in the light region. For reference, a single-pixel slice comprises the background and the plasma membranes were colored yellow. Note that the matrix (green) extends uninterrupted throughout the cytoplasm, independent of the region’s density, and associates directly with the plasma membrane. Panel B shows the “composition” map where densities of the matrix (green) and “soluble” proteins (brown and yellow) have been included. The material colored in gold constitutes the electron-dense layer that is seen associated with the plasma membrane in Fig. 1A, B. The different colors represent the different density values in the tomogram: yellow is the highest, green intermediate and brown the lowest. Bar: 0.12 μm.
