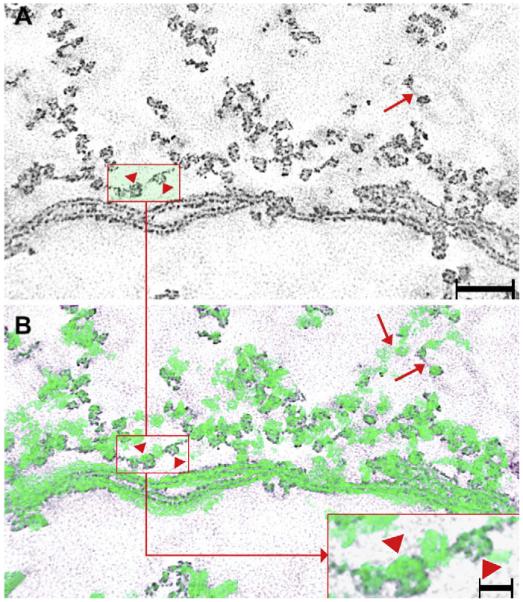
Fig. 5.

Low magnification views of “ghosts”. Panel A is a single-pixel slice showing the fiber’s plasma membrane and the “beaded” filaments. The plasma membrane can recognized by its trilayer structure while the “beaded” filaments can be identified by the thin filamentous core studded with box-shaped particles. The particles are spaced at distances of ~28 nm apart, center-to-center (arrow and arrowheads in the rectangle). Panel B shows the rendered volume of the “beaded” filaments (green) superimposed on the same single-pixel slide in panel A. In this way, additional particles on the filament can be seen in the clusters (compare rectangles in panels A and B). These particles represent the perpendicular intersections that occur between interacting filaments. The inset shows a higher magnification view of the rectangle in panel B to demonstrate the details of the particle distribution on the filament. Bar: 90 nm, inset: 15 nm.
