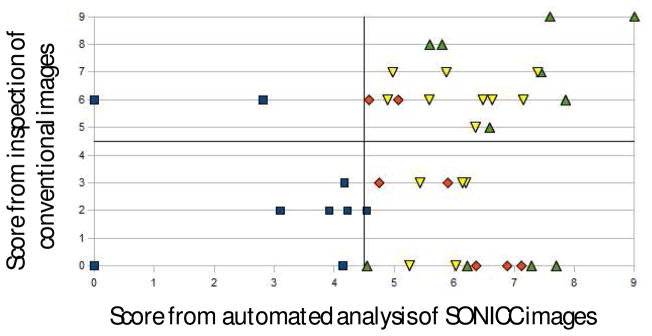
Figure 3.
Comparison of manual and automated scoring from different sets of images. The graph is divided into four regions based on the minimum score that was considered a positive in each case. Color coding and shapes indicate manual categorization based on inspection of the SONICC images: large crystals (green up-triangles), small crystals (yellow down-triangles), crystal showers (red diamonds), and minimal or no crystallization (blue squares).

