FIG. 2.
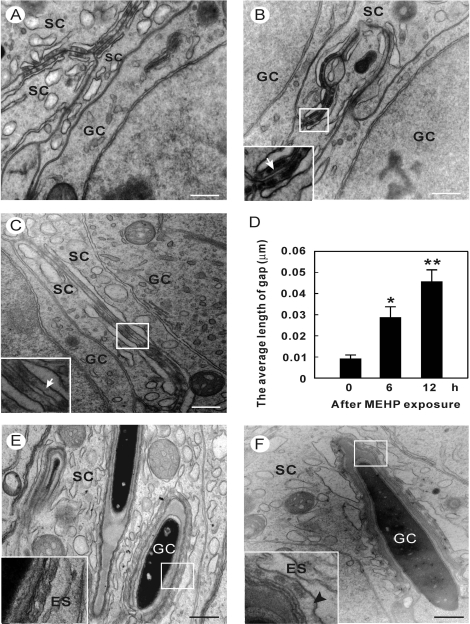
Transmission electron microscope reveals the changes in the ultrastructure of junctions in the seminiferous epithelium after MEHP exposure. A–C) The blood-testis barrier (BTB) in 28-day-old control and MEHP-treated mice (6 and 12 h) are examined. The white arrows indicate openings in the junctions between adjacent Sertoli cells after MEHP exposure. D) The average length of opening in tight junctions is measured. After 12 h exposure, the gap in tight junctions is significantly wider than control (*P < 0.05, **P < 0.01, Student t-test). Values represent the mean ± SEM. E and F) The apical ectoplasmic specialization (ES) between Sertoli cells and elongate spermatids in 28-day-old control and MEHP-treated mice (12 h) are examined. The black arrowhead indicates the area of disorganized actin filaments. SC = Sertoli cell; GC = germ cell. Small boxed image represents the close view of disrupted junctions. Bar = 500 nm with magnification ×22 000.

