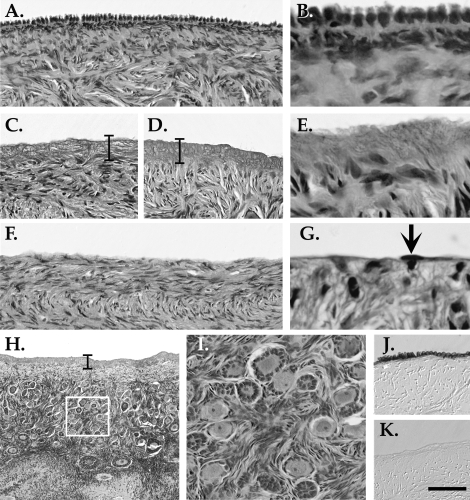
FIG. 4.
Cell lysis at the ovarian surface. A) H&E labeling of a tissue section from an untreated ovary, showing normal OSE. B) Higher magnification of A. C and D) H&E labeling after mild abrasion and exposure to 1% SDS for (C) 1 min or (D) 5 min, showing loss of OSE and cell nuclei to a depth of 40 μm into the underlying matrix. Brackets highlight this zone. E) Higher magnification of the slide shown in D. F) H&E labeling of tissue treated with 1% SDS and mild abrasion for 5 min and collected 4 days later, showing an absence of OSE but no cell-free band beneath the ovarian surface. G) Higher magnification of F. Arrow indicates a single cell at the surface. H) Lower magnification of the slide shown in D, showing deeper stromal and cortical layers and early stage follicles. White box indicates the region shown in I, with intact early stage follicles. J and K) E-Cadherin labeling of an (J) untreated ovary and a (K) detergent-treated ovary. Bar = 50 μm, (A, C, D, F, I–K), 10 μm (B, E, G), and 150 μm (H).

