FIG. 6.
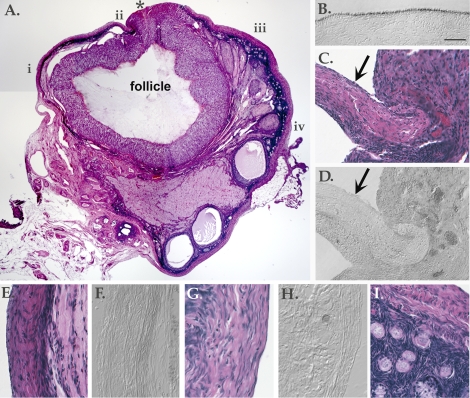
Long-term effects of detergent treatment. A) Photomontage of an H&E-labeled section from an ovary treated with 1% SDS for 5 min and collected 6 wk later. Asterisk (*) marks the site of follicle rupture. Areas shown at higher magnification in other panels of this figure are denoted by i–iv. B) E-Cadherin labeling of a section from an untreated ovary. This slide was processed in parallel with other E-cadherin-labeled slides shown in this figure. C) H&E-labeled slide showing area ii. Arrow indicates a group of cells at the surface. D) E-Cadherin labeling showing area ii. Arrow indicates a group of unlabelled cells at the surface. E) H&E-labeled slide showing area i. F) E-Cadherin labeling showing area i. G) H&E-labeled slide showing area iv. H) E-Cadherin labeling showing area iv. I) H&E-labeled slide showing area iii, beneath the surface to display underlying stromal and cortical layers with early stage follicles. Bar = 1 mm (A) and 50 μm (B–I).

