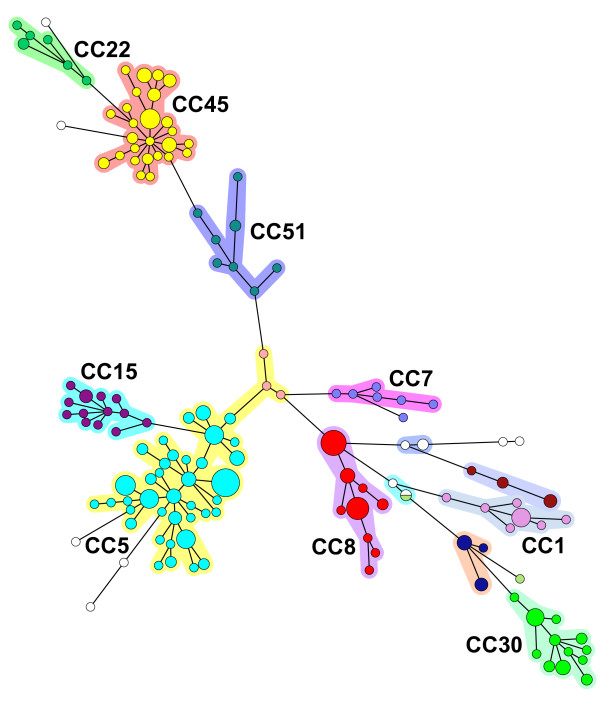
Figure 1.
Minimum spanning tree representation of the MLVA clustering for 278 isolates. Each circle represents a genotype. The size is proportional to the number of samples with a given genotype (1, > = 2, > = 5, > = 10, > = 20). The corresponding MLST clonal complexes are indicated. Clusters are coloured using the same colour code as in Figure 2 and 3.

