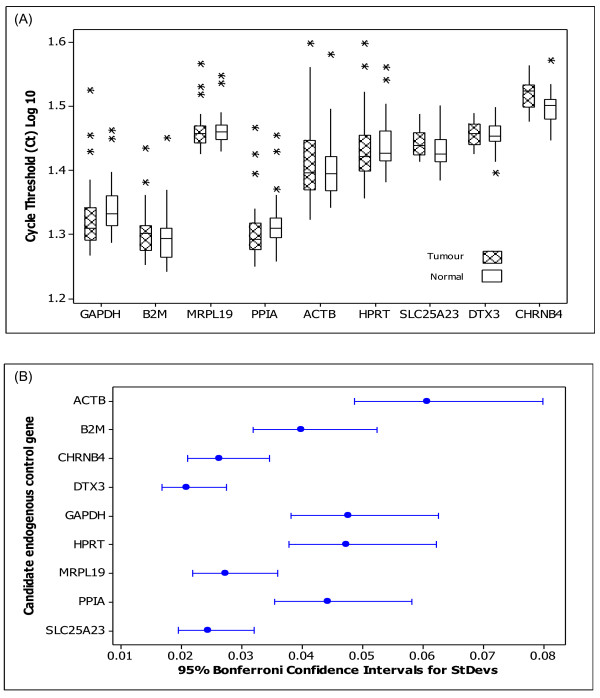
Figure 1.
Scaled expression levels and variation of each candidate EC gene. (A) Log 10 of cycle threshold of candidate EC genes ACTB, B2M, GAPDH, HPRT, MRPL19, SLC25A23, DTX3, CHRNB4 and PPIA in tumour and normal colorectal tissues. Boxplot shows interquartile range box, median, range whiskers and outliers (*). Within gene, differences were found in expression between tissue groups in both SLC25A23 (p = 0.040) and CHRNB4 (p = 0.002) but not the other genes (p > 0.05) (ANOVA). (B) Variation associated with EC gene expression. There was a significant difference in variation associated with gene expression (p < 0.001) with ACTB, GAPDH and HPRT showing greater variation than B2M, MRPL19 or PPIA. DTX3, CHRNB4 and SLC25A23 showed the least variations (Levene's test).

