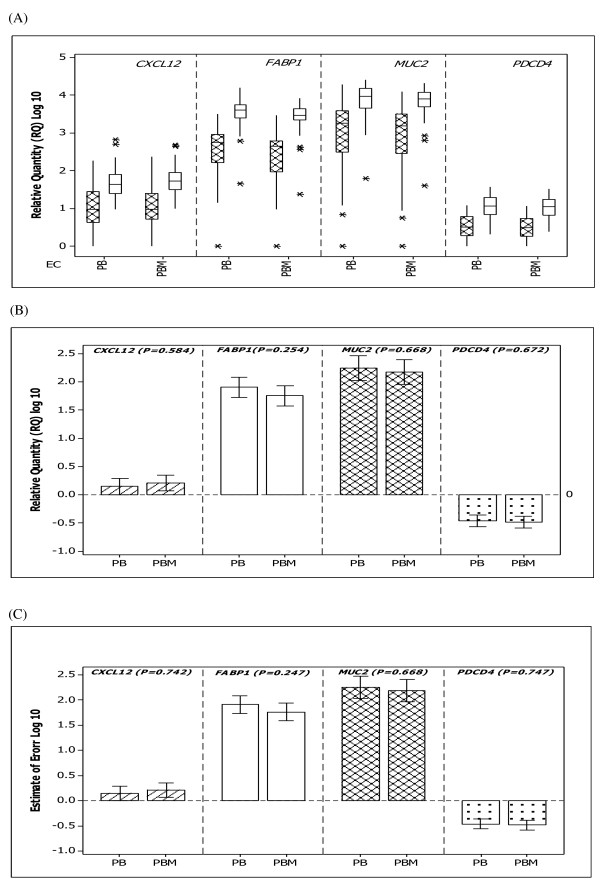
Figure 3.
Relative quantity of CXCL12, FABP1, MUC2 and PDCD4 in colorectal tissue. Error bars indicate 95% confidence intervals. No significant differences in the relative quantities of target genes were found using a combination of PPIA and B2M (PB) genes in comparison to the use of combination of PPIA, B2M and MRPL19 (PBM) EC genes (ANOVA).

