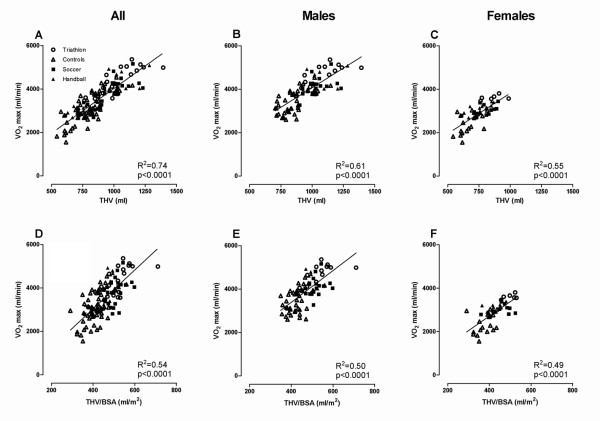
Figure 2.
The relationship between total heart volume (THV) and peak oxygen uptake ( ). The upper panel shows the relationship between absolute THV and
  for A) all subjects, B) males and C) females. The lower panel shows the relationship between THV normalized for body surface area (BSA) and
  for D) all subjects, E) males and F) females. For both males and females,
  was significantly correlated to THV and to THV/BSA. Abbreviations: BSA = body surface area, THV = total heart volume,
  = peak oxygen uptake

