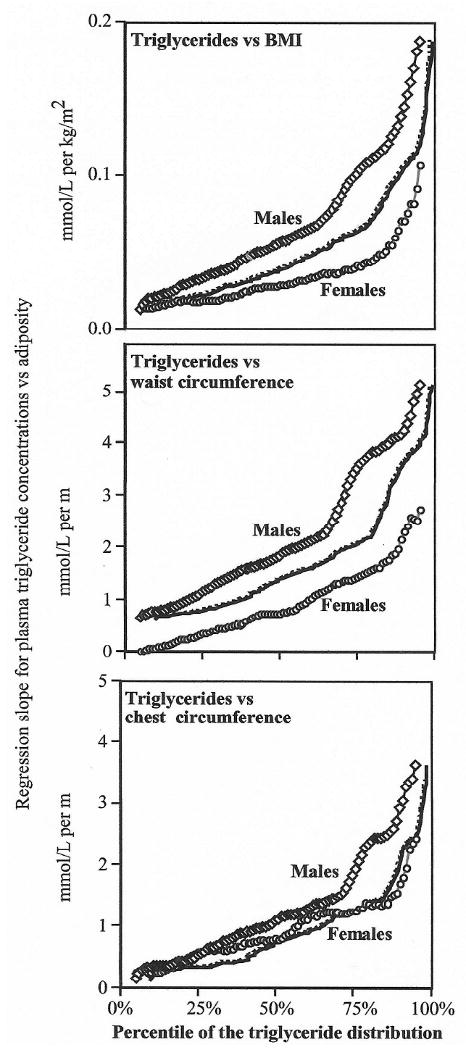
Fig. 3.

Plot of the regression slopes for plasma triglycerides (mmol/l) vs. BMI (kg/m2), waist circumference (m) and chest circumference (m) at all percentile of the triglyceride distribution in men and women (solid lines) and for the men's slopes adjusted to the women's cumulative distribution (dashed line).
