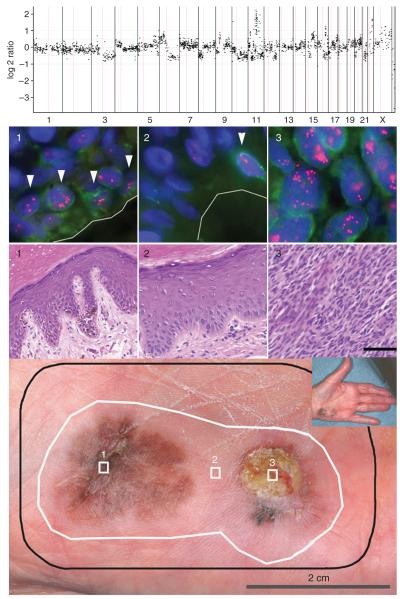
Figure 3. Case AB.
Bottom panel: (1) melanoma in situ; (2) clinically, dermoscopically, and microscopically normal skin; (3) invasive melanoma of 3.0 mm thickness. Black line: surgical margin; white line: field cell margin identified by amplification of 11q13. Top panel: array CGH profile of area 3. A log 2 ratio of 0 indicates normal copy number, and narrow spikes of increased copy number indicate regions of amplification that include 11q13. Middle panel: H&E and FISH for areas 1–3. FISH images represent one plane, so not all signals are visible. A green immunofluorescent stain to Melan-A was used to aid in identifying basal melanocytes. Cells with amplification of 11q13 are highlighted by arrowheads for areas 1 and 2. Bars (H&E) = 60 μm.

