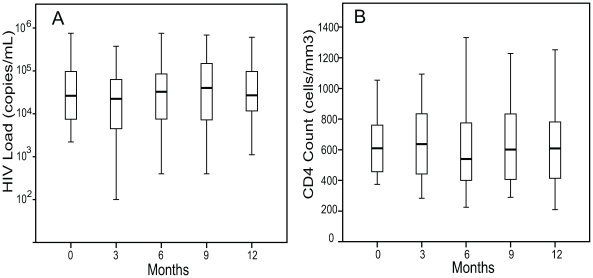
Figure 2. Change in HIV Load and CD4 Counts in response to TB therapy.
A. HIV log10 RNA viral loads on standard TB therapy at baseline, 3, 6, 9, and 12 months. B. CD4 counts at baseline, 3, 6, 9, and 12 months (n = 38 for all time points). The boxes indicate the interquartile ranges, the horizontal lines transecting the boxes indicate the medians, and the whiskers indicate the highest and lowest values. All values with P>.05.

