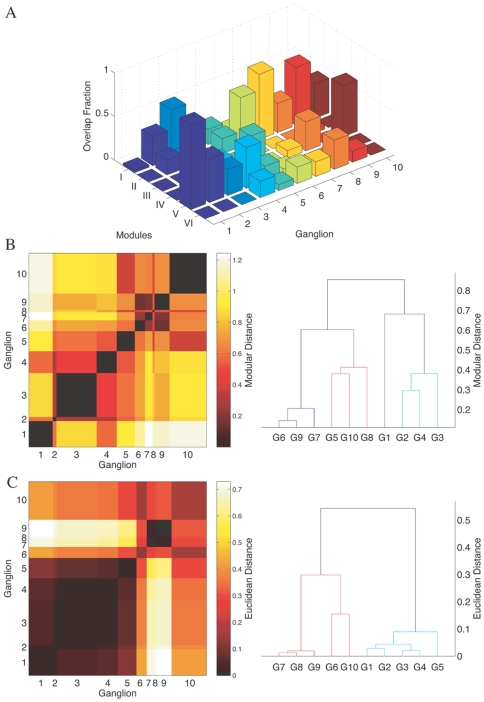
Figure 4. Modular decomposition of neurons in different ganglia.
(A) Neurons belonging to different ganglia are decomposed according to their modular membership. The height of each bar in the histogram corresponds to the overlap between the ganglia and the modules, calculated as the fraction of neurons that are common to a particular ganglion and a specific module. (B) The matrix representing the average modular distance between the different ganglia, as calculated from the modular decomposition spectrum of each ganglion. The corresponding dendrogram indicates the closeness between different ganglia in the abstract 6-dimensional “modular” space. (C) The matrix of physical distances between the ganglia is shown for comparison with (B), calculated as the average distance between neurons belonging to the different ganglia. The corresponding dendrogram indicates the closeness between ganglia according to the geographical nearness of their constituent neurons in the nematode body. The difference indicates that the ganglia which are geographically close may not be neighbors in terms of their modular spectra.

