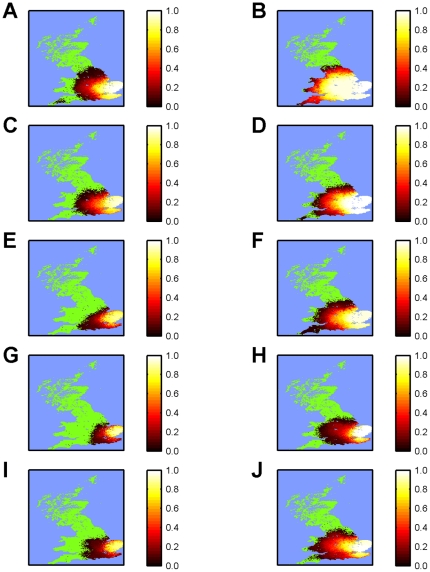
Figure 2. Predicted spatial distribution of BTV-8 in GB under different vaccination and temperature scenarios.
The different maps represent the extent of the predicted spatial spread up to the end of 2008 under different scenarios for vaccination and temperature: (A, B) no vaccination; vaccination with (C, D) 50% uptake; (E, F) 80% uptake; (G, H) 95% uptake; and (I, J) variable levels of uptake (95% in the 2007 protection zone, 75% in the 2007 surveillance zone and 50% elsewhere). Simulations are based on (A, C, E, G, I) 2007 or (B, D, F, H, J) 2006 temperatures, assuming the best-fit Gaussian kernel to the north European data, a time to full protection in cattle of 60 dpv and vaccine efficacy of 100%. The maps show the cumulative risk (see colour bars) expressed as the proportion of simulated outbreaks (out of 30 which took off; see Methods) for which at least one farm was affected by BTV within each 5km grid square.

