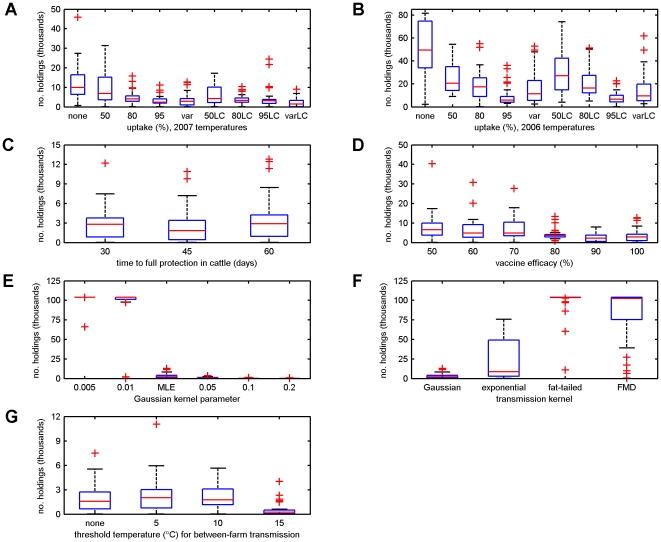
Figure 3. Sensitivity analysis of predicted outbreak size for BTV-8 in GB.
Impact of: (A,B) vaccination uptake assuming (A) 2007 or (B) 2006 temperatures (see Table 1 for codes for different uptake levels); (C) time to full protection in cattle; (D) vaccine efficacy; (E) Gaussian kernel parameter; (F) shape of the transmission kernel; and (G) a threshold temperature below which no transmission between farms was assumed to occur. The default scenario assumed variable vaccine uptake, 2007 temperatures, a time to full protection in cattle of 60 dpv, vaccine efficacy of 100% and the best-fit Gaussian kernel to the north European data (i.e. no temperature dependence). The boxplots show the median (red line) and the 25th and 75th percentile (blue box); the whiskers indicate 1.5 times the interquartile range; and the red crosses show outlying values for the cumulative number of affected holdings at 3 November 2008.

