
Table 1.
In vivo assessments and in vitro kinase assays of DM and selected analogs
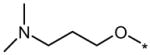
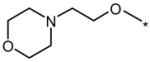
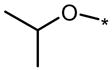
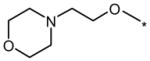
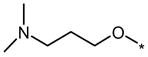
| Compound | R1 | R2 | Dorsalization (EC100, μM) | ISV disruption (EC50, μM) | Toxicity (EC100, μM) |
|---|---|---|---|---|---|
| DM |  |
 |
2.5 | 5 | 20 |
| LDN- 193189 |  |
 |
3 | 20 | 20 |
| 6LE | 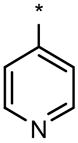 |
 |
5 | 50 | No (>50) |
| 6K1 | 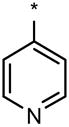 |
 |
1 | 5 | 20 |
| 91E |  |
 |
2 | 2 | 5 |
| 6LP |  |
 |
No (>50) | No (>50) | No (>50) |
| DMH1 |  |
 |
0.2 | No (>50) | No (>50) |
| DMH2 |  |
 |
0.1 | No (>50) | 25 |
| DMH3 | 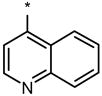 |
 |
1 | No (>50) | No (>50) |
| DMH4 |  |
 |
No (>50) | 1 | No (>50) |
| SU5146 | 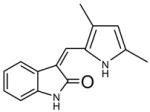 |
No | 2 | 5 | |
Dorsomorphin (DM) and the selected analogs, along with the R1 and R2 structural modifications and the effects on zebrafish embryos with respect to the dorsoventral (DV) axis, the intersomitic vessel (ISV) disruption and nonspecific toxicity. For dorsalization, the EC100 (effective concentration 100%) represents the concentration when 100% of the treated embryos are severely dorsalized. Due to significant day-to-day variability in severity of dorsalization at “sub-threshold” concentrations, the EC50 for severe dorsalization could not be reliably determined. For ISV disruption, the EC50 represents the concentration when the formation of about 50% of the ISVs is inhibited. For nonspecific toxicity, the EC100 represent the concentration when 100% of the treated embryos exhibit either early lethality within hours of compound addition, variable embryonic defects or developmental delay. For comparison, the effects of the known KDR inhibitor SU5416 are shown at the bottom. Results from at least 20 embryos per condition.