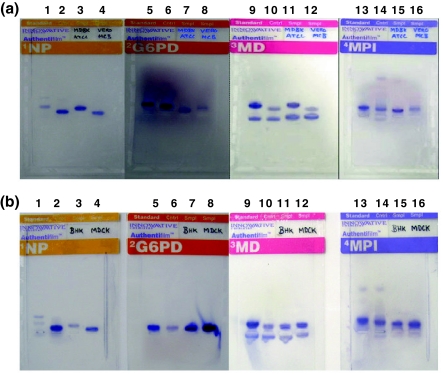
Fig. 3.
Results of Isoenzyme analyses done for species identification of animal cells. The species specific migration distances were calculated using enzyme migration data and decision tree analysis forms supplied by the manufacturer. a Isoenzyme analysis of MDBK and VERO cell lines showing species specific bands of NP, G6PD, MD and MPI enzymes. Lanes 1 to 4 show NP enzyme specific bands of standard, control, MDBK (Bovine) and VERO (African green monkey), respectively. Lanes 5 to 8 show G6PD enzyme specific bands of standard, control, MDBK (Bovine) and VERO (African green monkey), respectively. Lanes 9 to 12 show MD enzyme specific bands of standard, control, MDBK (Bovine) and VERO (African green monkey), respectively. Lanes 13 to 16 show MPI enzyme specific bands of standard, control, MDBK (Bovine) and VERO (African green monkey), respectively. b Isoenzyme analysis of BHK-21 and MDCK cell lines showing species specific bands of NP, G6PD, MD and MPI enzymes. Lanes 1 to 4 show NP enzyme specific bands of standard, control, BHK-21 (Syrian hamster) and MDCK (canine), respectively. Lanes 5 to 8 show G6PD enzyme specific bands of standard, control, BHK-21 (Syrian hamster) and MDCK (canine), respectively. Lanes 9 to 12 show MD enzyme specific bands of standard, control, BHK-21 (Syrian hamster) and MDCK (canine), respectively. Lanes 13 to 16 show MPI enzyme specific bands of standard, control, BHK-21 (Syrian hamster) and MDCK (canine), respectively

