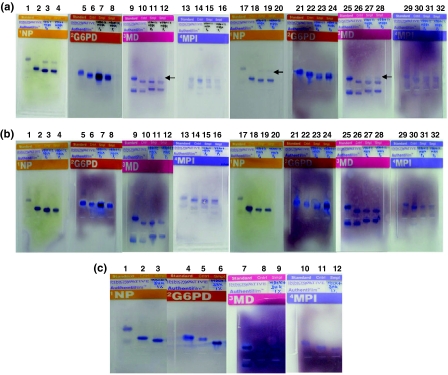
Fig. 4.
Results of Isoenzyme analysis done for detecting deliberate contamination of animal cells. The species specific migration distances were calculated using enzyme migration data and decision tree analysis forms supplied by the manufacturer. aLanes 1 to 16 show isoenzyme analysis of VERO cell line contaminated with 1% of MDBK showing species specific bands of NP, G6PD, MD and MPI enzymes of cells at P0 and P1, respectively. Standards are shown in lanes 1, 5, 9, and 13, controls are shown in lanes 2, 6, 10, and 14, samples of VERO + 1% MDBK (P0) are shown in lanes 3, 7, 11, and 15, and samples of VERO + 1% MDBK (P1) are shown in lanes 4, 8, 12, and 16. Lanes 17 to 32 show isoenzyme analysis of VERO cell line contaminated with 1% of MDBK showing species specific bands of NP, G6PD, MD and MPI enzymes of cells at P2 and P3, respectively. A faint band of NP and MD isoenzymes specific to bovine species (contaminant MDBK cell line) is seen but G6PD and MPI specific bands are not seen in all three passages. The identity of VERO cell line is confirmed by the four isoenzymes. Standards are shown in lanes 17, 21, 25, and 29, controls are shown in lanes 18, 22, 26, and 30, samples of VERO + 1% MDBK (P2) are shown in lanes 19, 23, 27, and 31, and samples of VERO + 1% MDBK (P3) are shown in lanes 20, 24, 28, and 32. Lanes 1 to 4, 17 to 20 show specific bands of NP, lanes 5 to 8, 21 to 24 show specific bands of G6PD, lanes 9 to 12, 25 to 28 show specific bands of MD, and lanes 13 to 16, 29 to 32 show specific bands of MPI. bLanes 1 to 16 show isoenzyme analysis of VERO cell line contaminated with 1% of MDCK showing species specific bands of NP, G6PD, MD and MPI enzymes of cells at P0 and P1, respectively. Standards are shown in lanes 1, 5, 9, and 13, controls are shown in lanes 2, 6, 10, and 14, samples of VERO + 1% MDCK (P0) are shown in lanes 3, 7, 11, and 15, and samples of VERO + 1% MDCK (P1) are shown in lanes 4, 8, 12, and 16. Lanes 17 to 32 show isoenzyme analysis of VERO cell line contaminated with 1% of MDCK showing species specific bands of NP, G6PD, MD and MPI enzymes of cells at P2 and P3, respectively. Canine species specific isoenzyme bands are not seen in all the three passages but the identity of VERO cell line is confirmed by the four isoenzymes. Standards are shown in lanes 17, 21, 25, and 29, controls are shown in lanes 18, 22, 26, and 30, samples of VERO + 1% MDCK (P2) are shown in lanes 19, 23, 27, and 31, and samples of VERO + 1% MDCK (P3) are shown in lanes 20, 24, 28, and 32. Lanes 1 to 4, 17 to 20 show specific bands of NP, lanes 5 to 8, 21 to 24 show specific bands of G6PD, lanes 9 to 12, 25 to 28 show specific bands of MD, and lanes 13 to 16, 29 to 32 show specific bands of MPI. c Isoenzyme analysis of MDCK cell line contaminated with 1% of BHK-21 cells. The contaminant BHK-21 cell line specific isoenzyme bands are not seen in all the three passages but the identity of MDCK cell line is confirmed by all the four isoenzymes. Lanes 1 to 3 show NP enzyme specific standard, control and MDCK (canine) bands, respectively. Lanes 4 to 6 show G6PD enzyme specific standard, control and MDCK (canine) bands, respectively. Lanes 7 to 9 show MD enzyme specific standard, control and MDCK (canine) bands, respectively. Lanes 10 to 12 show MPI enzyme specific bands of standard, control and MDCK (canine) bands, respectively

