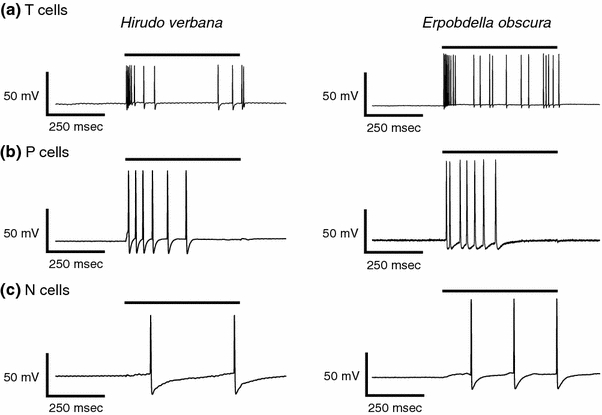
Fig. 4.

Responses of T, P and N cells to mechanical stimulation of the body wall in Hirudo and Erpobdella. a Representative traces showing the response of a T cell in Hirudo (left) and Erpobdella (right) to a 500 ms stimulation of the body wall with a force of 100 mN/mm2. The black bar represents when the mechanical stimulus was applied. b Representative traces showing the response of a P cell in Hirudo (left) and Erpobdella (right) to a stimulation of the body wall with a force of 100 mN/mm2. c Representative traces showing the response of an N cell in Hirudo (left) and Erpobdella (right) to a stimulation of the body wall with a force of 100 mN/mm2
