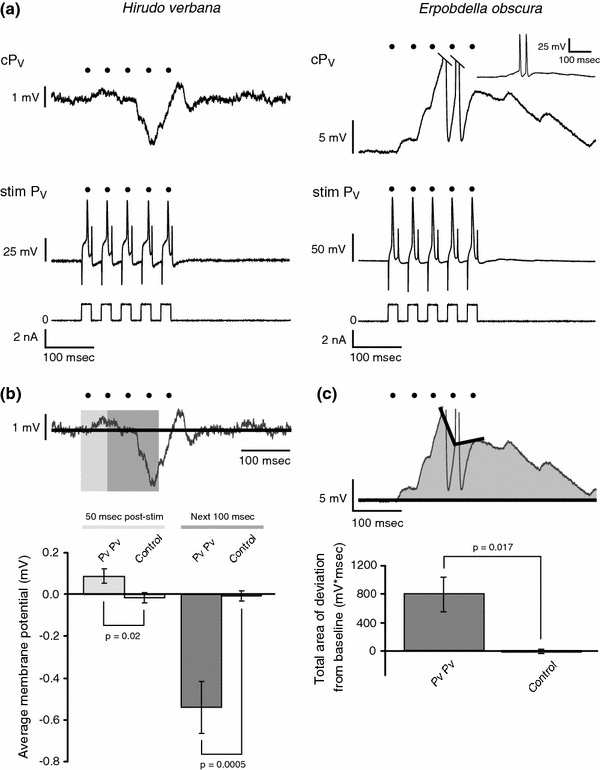
Fig. 5.

PV to PV connections in Hirudo and Erpobdella. a Representative response of a ventral P cell (P V) to stimulation of the other PV in a Hirudo (left) and Erpobdella (right) midbody ganglion. The bottom trace shows the stimulus protocol, the middle trace shows the action potentials produced in the stimulated PV (stim P V) by the depolarizing pulses, and the top trace shows the response of the contralateral, non-stimulated PV (cP V). In this trace, as well as in all other panels, black dots show the times of the peaks of the action potentials in the stimulated P cell. In Erpobdella, the tops of the action potentials were cropped in the top trace. The inset shows the complete response of the non-stimulated PV cell at a reduced amplification and a compressed time scale. Capacitance artifacts in the middle trace of Hirudo were partially deleted using Adobe Illustrator. b Average change in membrane potential relative to baseline in the non-stimulated PV in Hirudo. The trace is the same as the top trace in a. The solid black line indicates the mean baseline membrane potential. The light gray box is the first 50 ms of stimulation. The dark gray box is the next 100 ms. The bar graph shows the mean change in membrane potential from baseline over the first 50 ms after stimulation and over the subsequent 100 ms. The control bars are the mean change in membrane potential in the non-stimulated PV over 50 ms and the next 100 ms beginning 2 s after the end of the stimulus bursts. The error bars indicate SEM; n = 13. c Quantification of the depolarization observed in the non-stimulated PV in Erpobdella. The trace is the same as the top trace in a. The mean pre-stimulus membrane potential is represented by the black line. The area of the deviation from the baseline membrane potential is shaded in gray. The bar graph shows the mean shaded area in the non-stimulated PV in the 500 ms following the first current pulse in the stimulated cell. The action potentials were not included in our calculation of deviation from baseline (see “Methods”). The control bar is the mean shaded area in the non-stimulated PV over 500 ms beginning 2 s after the end of the stimulus bursts. The error bars indicate SEM; n = 7. P V ventral P cell, stim stimulated, c contralateral
