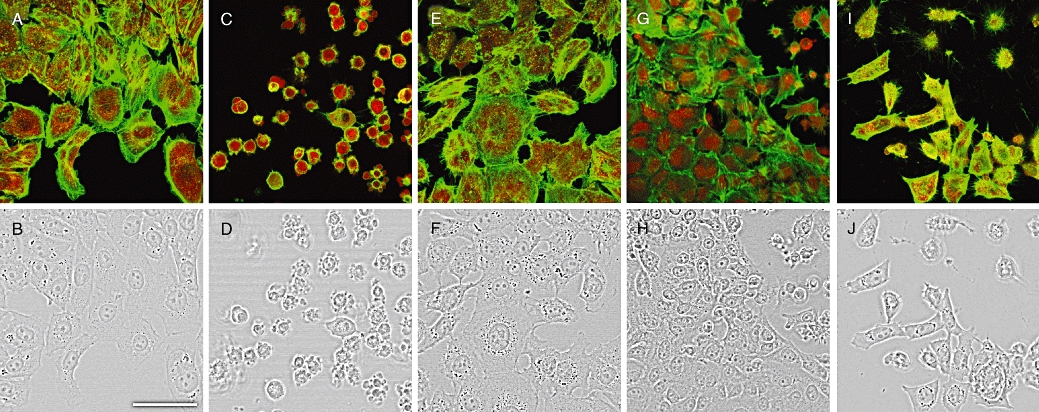
Figure 2.

Confocal imaging of F- and G-actin double-staining of Clone 9 rat hepatocytes showing fluorescence (upper row). Transmission pictures of the same cells are presented in the lower row. F and G-actin were labelled with Oregon Green 514 phalloidin and Texas Red DNase I respectively. Figure 2A and B show photographs from control cells, while Figure 2C and D are from cells treated with 1.5 µM OA, Figure 2E and F with 1.5 µM MC-LR, Figure 2G and H with 1.5 µM MeOk and (I) and (J) with 15 µM MeOk. Images are representative of 3 independent experiments. Images are 2× zoom magnifications. Scale bar = 50 µm. MC-LR, microcystin-leucine and arginine; MeOk, methyl okadaate; OA, okadaic acid.
