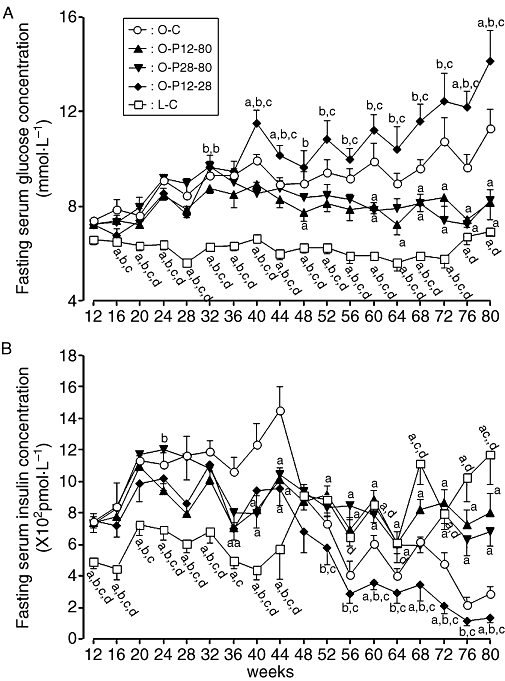
Figure 2.

Serial changes in fasting serum glucose (A) and insulin (B) concentrations in rats treated with or without pravastatin. For key to groups, see Figure 1 legend. (a) Significant difference versus O-C group at corresponding age, and (b) significant difference versus O-P12-80 group at corresponding age; (c) significant difference versus O-P28-80 group at corresponding age; and (d): significant difference versus O-P12-28 group at corresponding age. Data are presented as mean ± SEM of seven to nine rats.
