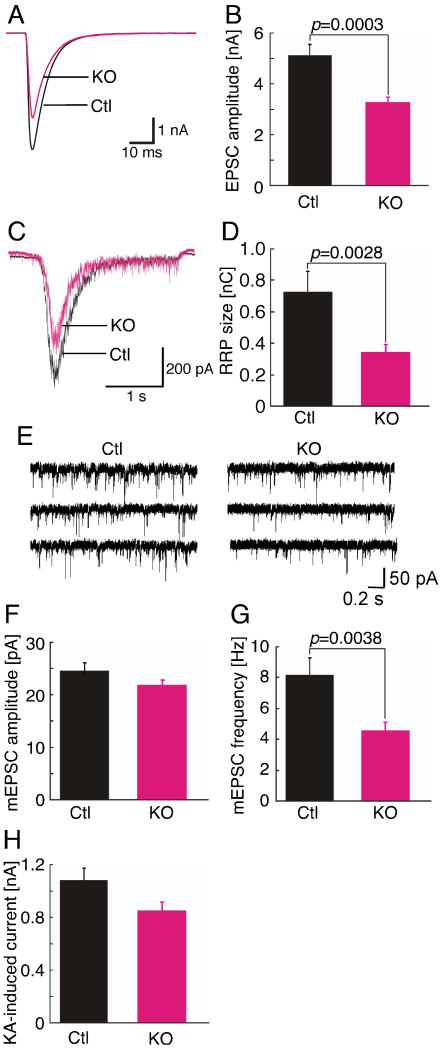
Figure 3. Reduced Synaptic Transmission in Nedd4-1-KO Neurons.
(A) Sample traces of evoked EPSCs from control (Ctl) and KO neurons.
(B) Averaged evoked EPSC amplitudes of control (Ctl) (n=70) and KO (n=82) neurons. Student's t-test, p=0.0003.
(C) Sample traces of postsynaptic currents evoked by the application of hypertonic sucrose solution from control (Ctl) and KO neurons.
(D) Mean readily releasable vesicle pool sizes as estimated by the charge integral measured after release induced by application of 0.5 M sucrose solution in control (Ctl) (n=58) and KO (n=61) neurons. Student's t-test, p=0.0028.
(E) Sample traces of miniature EPSCs from control (Ctl) and KO neurons.
(F) Averaged miniature EPSC amplitudes (Ctl, n=32; KO, n=40). Student's t-test, p>0.1.
(G) Averaged miniature EPSC frequencies (Ctl, n=32; KO, n=40). Student's t-test, p=0.0038.
(H) Averaged kainic acid-induced currents in control (Ctl, n=29) and KO neurons (n=32). Student's t-test, p>0.1.
See also Figures S3 and S4 and Table S3.

