
FIG. 5.
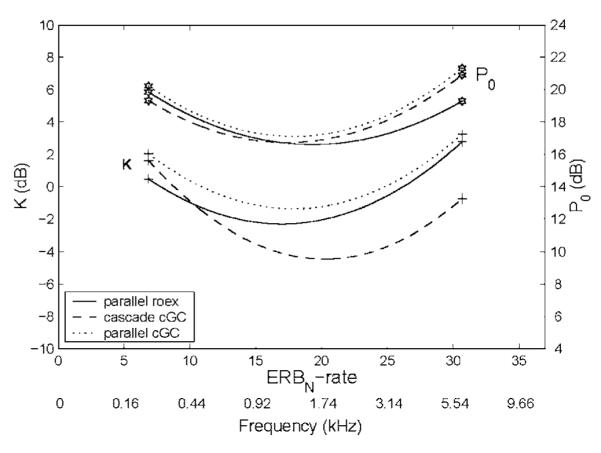
Values of the nonfilter coefficients, K and P0, plotted as a function of center frequency on the ERBN-rate scale for the parallel roex filter (solid line), the cascade cGC filter (dashed line), and the parallel cGC filter (dotted line). The K and P0 functions are identified by plus and star symbols, respectively, at the ends of the lines.