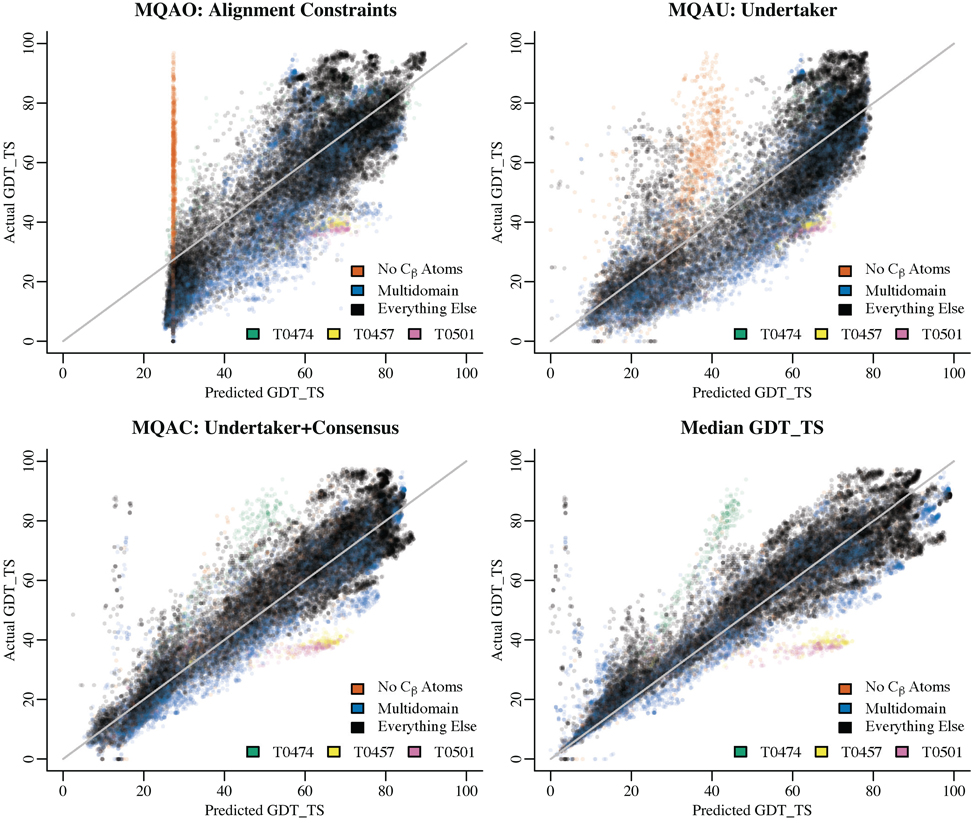
Figure 1.
Predicted and actual GDT_TS scores for all targets and all servers. For each QA function, a plot shows GDT_TS versus the predicted quality. Three of the plots are for submissions by groups MQAO, MQAU, and MQAC. Median GDT_TS is the pure consensus term, which we did not submit to CASP8. On the consensus plots, the models we examined with a near-zero predicted GDT_TS score but a high actual GDT score had file format issues such as an early TER record which likely prevented the reading of much of the PDB file. The outlying group at about (40, 80) on the median GDT_TS plot is target T0474 where much of the target is disordered. Predictions for T0474 were inconsistent for the disordered regions, resulting in a low predicted GDT_TS using the consensus-based measures. The outlying group at about (60, 40) on the median GDT_TS plot is composed of targets T0457 and T0501; both are two-domain targets with fairly consistent predictions. The predictions are accurate for each domain, but the domain packing is incorrect, resulting in a low GDT_TS score for the targets as a whole.

