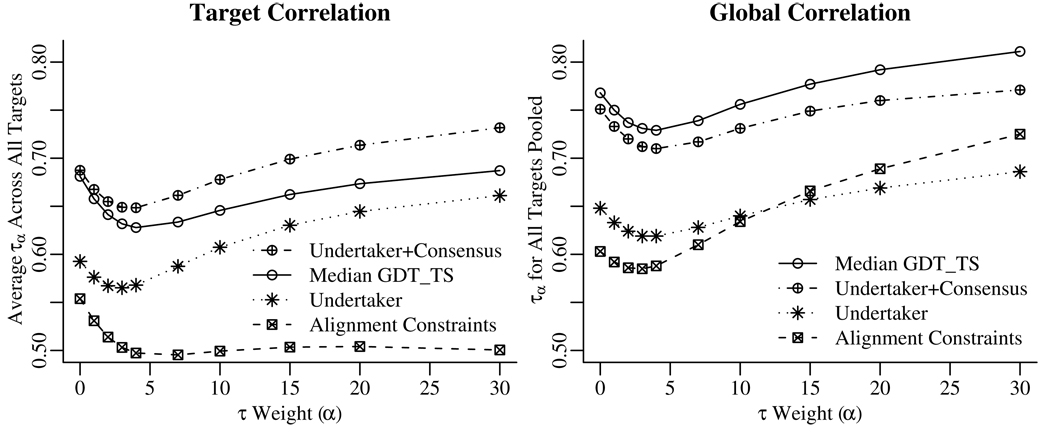
Figure 2.
Correlation values for each function. Increasing values of α place increasing weight on the predicted-best set of models. An α value of 0 is equivalent to Kendall’s τ, treating all models equally. Values of 0, 3, 5, 15, and 30 place half of the weight on the top 50%, 23%, 14%, 5%, and 2.3% of models. The target correlation plot shows the average τα values over all targets, with correlation computed separately for each target. The global correlation plot shows the τα values computed from combining all predictions into a single set. Adding Undertaker cost function terms to the consensus median GDT_TS method improved the ranking of models within a target, particularly when concentrating on the top-scoring models. Median GDT_TS alone is a better predictor of raw GDT_TS value, especially for picking out the easy targets, but does not do as well at ranking models for a given target. Furthermore, the alignment based constraints do better globally than the Undertaker cost functions (which include the alignment based constraints) for ranking the most accurate models; thus, the quality of these models can be better judged by consistency with alignments alone. “Alignment Constraints” is MQAO, “Undertaker” is MQAU, “Undertaker+Consensus” is MQAC, and “Median GDT_TS” is the pure consensus term, which we did not submit to CASP8.

