FIGURE 4.
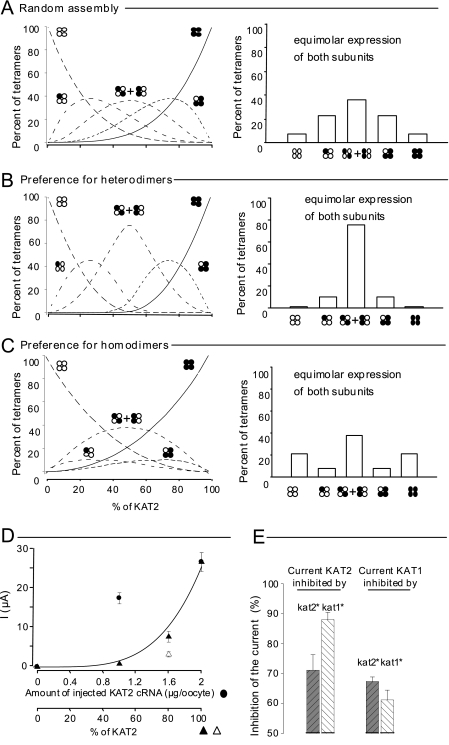
KAT1 and KAT2 subunit interactions computer-modeled and revealed by a dominant-negative approach in Xenopus oocytes. A–C, in silico prediction of the percentage of different tetramers formed in oocytes from a given stock of KAT1 (white circles) and KAT2 (black circles) subunits. Three hypotheses were considered (see details under “Experimental Procedures”): random assembly (A), preference for heterodimers (B), and preference for homodimers (C). Six types of tetramers (indicated by clusters of four white or black circles; see Fig. 1B) were expected to assemble from the initial stock of single subunits. Left panels, distribution of the assembled tetramers in the six possible combinations (expressed as percent, y axis) as a function of the proportion of KAT2 in the initial stock of subunits (expressed as percent, x axis). Right panels, bar graph representations of the same tetramer distribution in the particular case of equimolar expression of KAT1 and KAT2 subunits (50% abscissa in left panels, corresponding to the situation expected in the upper part of A and in Fig. 3, B and C). D, two-electrode voltage-clamp recordings made on oocytes bathed with a 100 mm K+ external solution. Data represent current values sampled at the end of a hyperpolarizing pulse of 1.7 s to −185 mV. Currents were recorded in oocytes injected with different amounts of wild-type KAT2 cRNA (black circles; the dotted line represents a linear regression adjusted to these points) or co-injected with wild-type KAT2 cRNA mixed with either dominant-negative kat2* cRNA (black triangles) or dominant-negative kat1* cRNA (white triangle). The dominant-negative mutation (*) is in the selectivity filter GYGD → RRGD (not functional) (20). The solid line represents the theoretical increase in the macroscopic current when the molar ratio of wild-type KAT2 subunits increases and when the association between wild-type and dominant-negative subunits is achieved randomly (from A; fits well with the KAT2 + kat2* data (black triangles) but not the KAT2 + kat1* data (white triangle)). E, KAT2 (left) and KAT1 (right) current inhibition by dominant-negative kat1* (white bars) and kat2* (black bars) subunits. All oocytes were co-injected with 1.6 ng of wild-type cRNA (KAT1 or KAT2) and 0.4 ng of mutant cRNA (kat1* or kat2*). Current values were sampled at the end of a hyperpolarizing pulse of 1.7 s to −185 mV and were normalized by the KAT2 (or KAT1) currents recorded at −185 mV in oocytes injected with 2 ng of KAT2 (or KAT1) cRNA. Results are displayed as means ± S.E. (n = 6).

