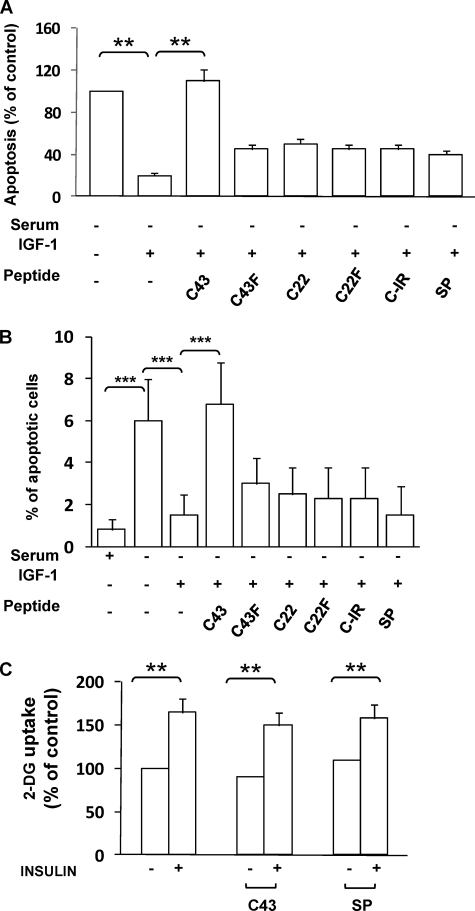
FIGURE 5.
Biological effect of reduced IGF-1R/PDK1 interaction in intact cells. A, MCF-7 cells, loaded with FITC-C43, -C43F, -C22, -C22F, -C-IR, or SP, were incubated in serum-free DMEM for 16 h in the presence or in the absence of IGF-1, and apoptosis was quantified by the ELISAPlus apoptosis detection kit as described under “Experimental Procedures.” Error bars represent mean ± S.D. of three different experiments in triplicate. Asterisks indicate statistically significant differences versus untreated cells (**, p < 0.01). B, MCF-7 cells, loaded with FITC-C43, -C43F, -C22, -C22F, -C-IR, or -SP, were incubated in serum-free DMEM for 16 h in the presence or in the absence of IGF-1. Cells were stained with propidium iodide, and the ratio of cells in sub-G1 phase was determined by cytometric analysis, as described under “Experimental Procedures.” Error bars represent mean ± S.D. of three different experiments in triplicate. Asterisks indicate statistically significant differences versus untreated cells (***, p < 0.001). C, L6 cells were incubated in serum-free medium for 16 h before exposure to 100 nm insulin for 30 min, as indicated. Alternatively, 10 μm C43 or SP were simultaneously added to serum-free medium in the presence or absence of insulin. Then the cells were assayed for 2-deoxy-glucose (2-DG) uptake as described under “Experimental Procedures.” Error bars represent mean ± S.D. of three different experiments in triplicate. Asterisks indicate statistically significant differences versus untreated cells (**, p < 0.01).

