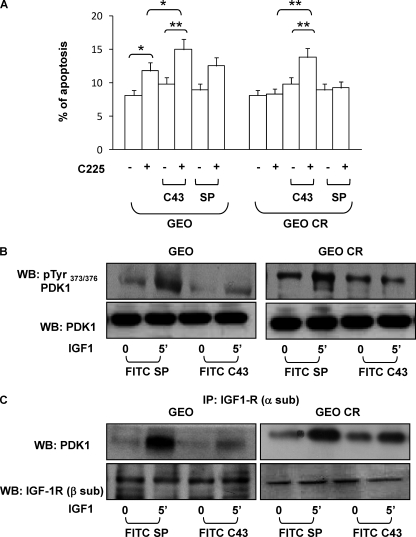
FIGURE 6.
Effect of C43 on cetuximab-induced apoptosis and IGF-1 signaling in GEO and GEO-CR cells. A, 10 μm FITC-C43 or FITC-SP was loaded into GEO and GEO-CR cells. After a 24-h treatment with cetuximab (C225), the cells were harvested, fixed, and stained with propidium iodide. The ratio of cells in sub-G1 phase was determined by cytometric analysis, as described under “Experimental Procedures.” Error bars represent mean ± S.D. of three different experiments in triplicate. Asterisks indicate statistically significant differences versus untreated cells (*, p < 0.05; **, p < 0.01). B, GEO and GEO-CR cells, treated with FITC-SP or FITC-C43, were exposed to 100 ng/ml IGF-1, as indicated, and then solubilized. Cell lysates (50 μg of protein/sample) were blotted with pTyr373/376-PDK1 antibody. To ensure equal PDK1 transfer, membranes were further blotted with PDK1 antibodies. Blots were revealed by ECL and autoradiography. WB, Western blot; IP, immunoprecipitate. C, GEO and GEO-CR cells were loaded with FITC-SP or with FITC-C43 and then stimulated for the indicated times with 100 ng/ml IGF-1. Cell lysates (200 μg/sample) were immunoprecipitated with anti-IGF-1R (α-sub) antibody, and then immunoprecipitated proteins were separated on SDS-PAGE. Western blot analysis was performed with anti-PDK1 and anti-IGF-1R β-subunit antibodies. Blots were revealed by ECL and autoradiography. The autoradiographs shown in B and C are representative of four independent experiments.

