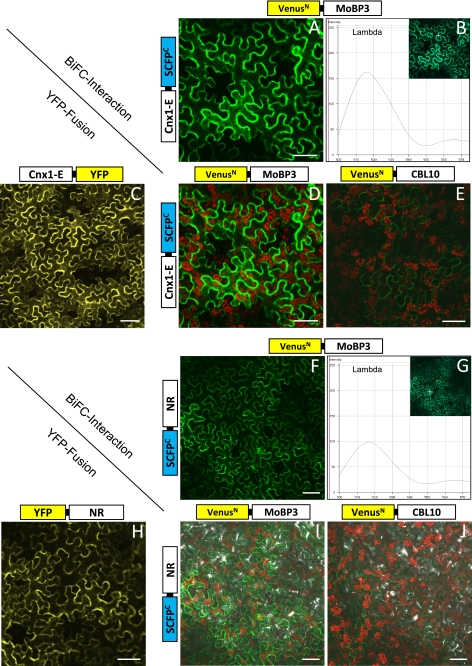
FIGURE 6.
BiFC of MoBP3 with Cnx1-E (A–E) and NR (F–J), respectively. In A and F the reconstitution of the fluorochrome is shown in the green channel mode, B and G give the spectral signature of the BiFC complex (peak at 515 nm) detected in the λ mode. C and H show the cytoplasmic fluorescence of Cnx1-E and NR with YFP fusion (expression control); D and I show the BiFC interaction signal of the protein partners studied plus chlorophyll autofluorescence; in E and J the negative interaction controls using cytoplasmic protein CBL10 in combination with MoBP3 and NR, respectively, are shown. Bars represent 50 μm.

