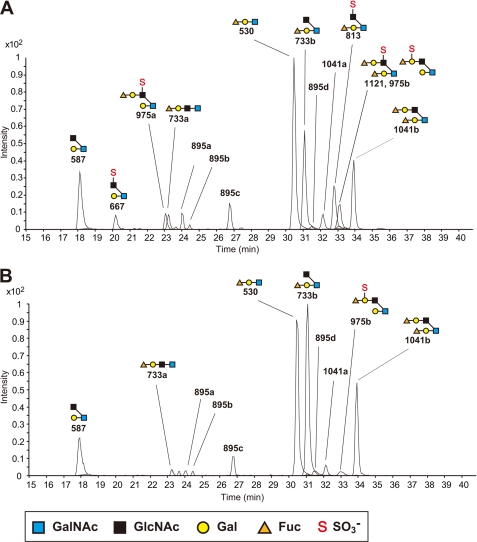
FIGURE 6.
LC-ESI-MS analysis of the oligosaccharides on colonic mucins. LC-ESI-MS total ion chromatogram of the oligosaccharides in the Muc2-enriched fraction from the colon of WT (A) and KO (B) mice. LC-ESI-MS was operated in the negative ion mode. The annotations correspond to the [M-H]− ions listed in Table 1. Data are representative of five independent experiments.

