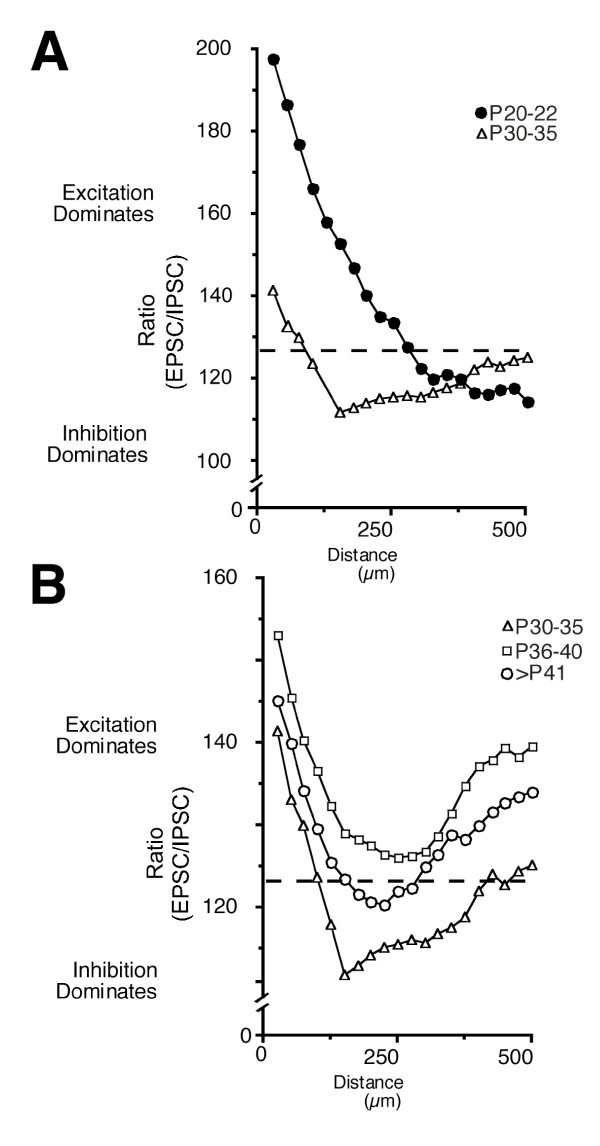
Figure 5.
Graph of the ratio of inhibition to excitation at increasing distance from the recorded neurons. Each point in the graph represents the average ratio at that distance from all the neurons recorded in that age group (see Methods). (A) Comparison of the P20 to P22 age group (black circles) with the P30 to P35 age group (triangles). In the P20 to P22 age group, excitation dominates the region close to the recorded neurons out to about 300 μm; from there inhibition dominates. In the P30 to 35 age group, excitation dominates only out to about 150 μm from the recorded neurons; at greater distances inhibition dominates. (B) Comparison of the P30 to P35 age group (triangles), P36 to P40 age group (squares) and mature group (>P41; circles) indicates that the shape of the distributions of ratios is similar at these different ages. These plots demonstrate that the basic arrangement of inhibitory and excitatory connections remains stable. However, values that form the distribution vary significantly between each age group (ANOVA, P < 0.05), reflecting changes in the relative amount of excitation and inhibition within each age group.

