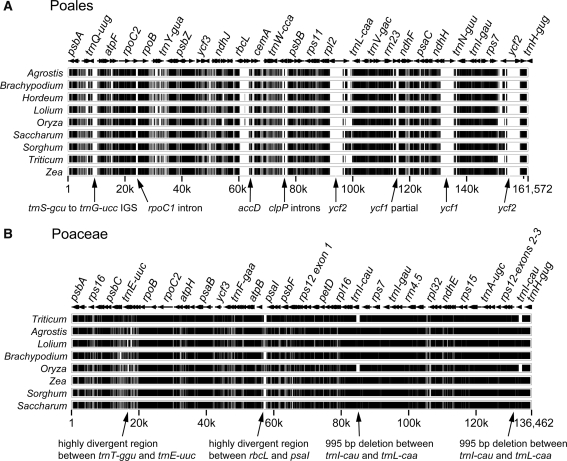
Fig. 2.
Multipip analyses (Schwartz et al. 2003) showing overall sequence similarity of plastid genomes based on complete genome alignment. Levels of sequence similarity are indicated by black (75–100%), gray (50–75%), and white (<50%). a Comparison of 10 members of Poales, using Typha latifolia as the reference genome. Arrows indicate gene/intron losses and deletions; partial duplication of ycf1 is due to IR expansion. b Comparison of nine Poaceae genomes using Hordeum vulgare as the reference genome. Arrows indicate deletions; 995 bp deletion is present twice because it is in the IR

