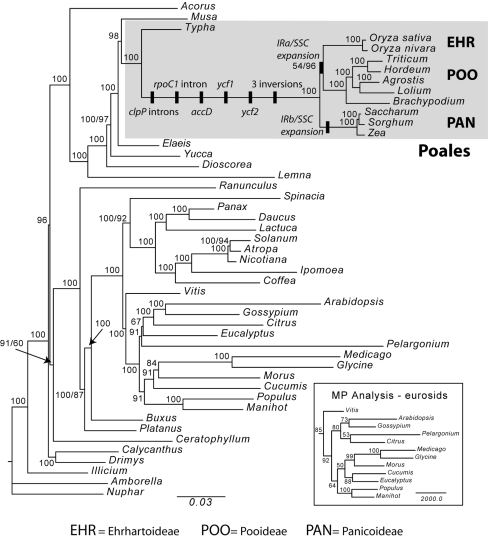
Fig. 4.
ML tree of 47 taxa for 73 protein-coding genes (−lnL = 568622.59691). MP analysis was generally congruent, but topological differences are shown in the inset. Bootstrap values are shown at nodes for ML/MP; and only one statistic is reported where values are the same except in the eurosid clade where ML values are shown on the full tree and MP values are on the inset. The Poales clade is shaded and genomic changes within Poales are indicated by black bars. Subfamilies sampled are shown (EHR Ehrhartoideae, POO Pooideae, PAN Panicoideae)

