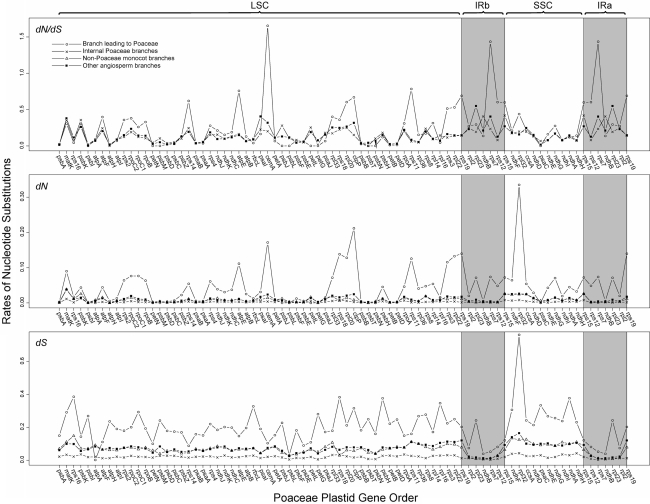
Fig. 6.
Average dN/dS, dN, and dS values per gene plotted across the length of the plastid genome using the grass gene order. Values for the branch leading to Poaceae (circles), internal Poaceae branches (“x”s), non-Poaceae monocot branches (triangles), and other angiosperm branches (squares) were compared. For values of dN/dS, black squares show both non-Poaceae monocot and other angiosperm branches due to PAML model parameters. Note that the scales are different for dN/dS, dN, and dS plots

