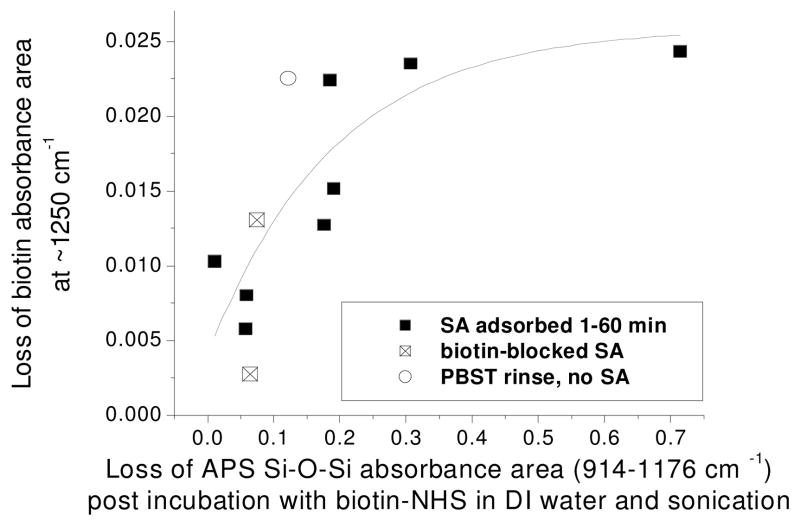
Figure 7.
Loss of biotin band absorbance area at ~1250 cm−1 after SA adsorption and PBST rinsing (or rinsing without SA adsorption) versus APS Si-O-Si band area loss after exposure of APS surface to biotin-NHS in DI water and subsequent sonication (black squares, open squares and open circle indicate SA specific adsorption, biotin-blocked SA adsorption and PBST rinse only, respectively). Least squares fit; R2 = 0.61, all points included.

