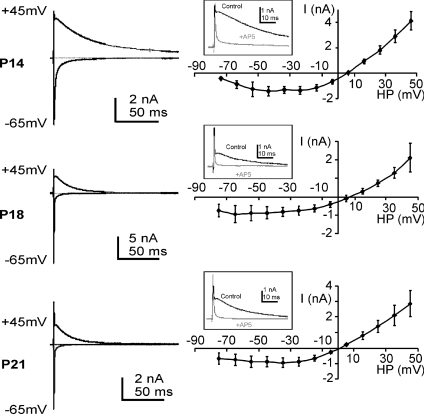
Figure 2. The NMDAR-EPSC shows declining amplitude and accelerating decay during maturation.
Example EPSCs for +45 mV and −65 mV holding potentials are shown superimposed (left) for examples recorded from rat MNTB neurons at P14, P18 and P21. The mean I–V relationships (non-isochronal) for the NMDAR-EPSC are shown (right) for the same ages. Insets show example traces at positive holding potentials demonstrating block of the outward slow EPSC current by the NMDAR antagonist AP-5. Data are means ±s.e.m. from 3 neurons per data point from rat calyx of Held/MNTB recordings.

