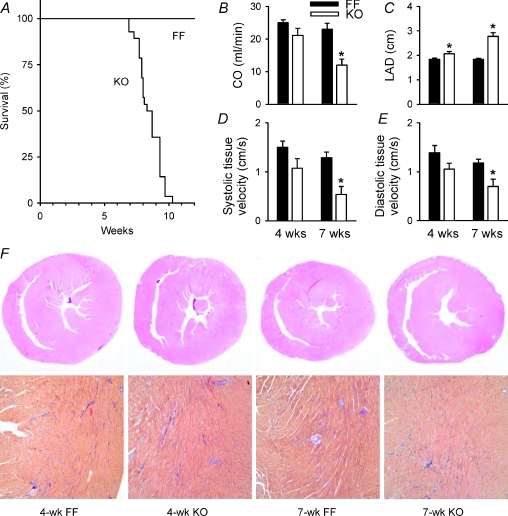
Figure 1. Progression to end-stage HF in KO mice involved impairment of systolic and diastolic function.
A, survival curves (FF, n= 26; KO, n= 27). Echocardiographic measurements of cardiac output (B), left atrial diameter (C), systolic tissue velocity (D), and diastolic tissue velocity (E) (FF, n= 6; KO, n= 5). F, whole heart histological sections at 20× (top panels, hematoxylin/eosin) and 100× magnification (bottom panels, AFOG, with blue staining indicating fibrosis). *P < 0.05 vs. equivalent FF.

