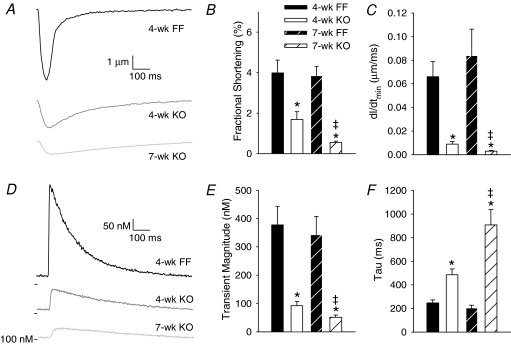
Figure 2. Contractions and Ca2+ transients became progressively smaller and slower to decline in KO cardiomyocytes.
A, representative contraction traces, from isolated myocytes during 1 Hz field stimulation. Mean fractional shortening (B) and maximum relaxation velocity measurements (C). Representative Ca2+ transients recorded by fluo-4 fluorescence (D). Mean Ca2+ transient magnitudes (E) and decay kinetics (F). (n for panels B and C, E and F: 4-week FF = 13, 16; 4-week KO = 13, 20; 7-week FF = 15, 19; 7-week KO = 11, 19; *P < 0.05 vs. equivalent FF, ‡P < 0.05 vs. equivalent 4-week).

