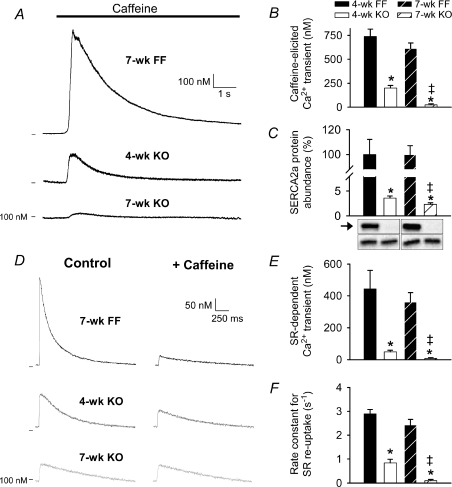
Figure 3. Minute SR function was present in 4-week, but not 7-week KO.
Representative caffeine-elicited Ca2+ transients (A) and magnitude measurements (B). Expression levels of SERCA2a (arrow) vs. calsequestrin (lower bands) (C). SR Ca2+ release during each beat was assessed by comparing Ca2+ transients in the presence and absence of caffeine (D). SR Ca2+ release (E) and reuptake (F). (n for panels B and C, E and F: 4-week FF = 13, 5, 9; 4-week KO = 20, 6, 19; 7-week FF = 20, 6, 18; 7-week KO = 19, 7, 19; *P < 0.05 vs. equivalent FF, ‡P < 0.05 vs. equivalent 4-week).

