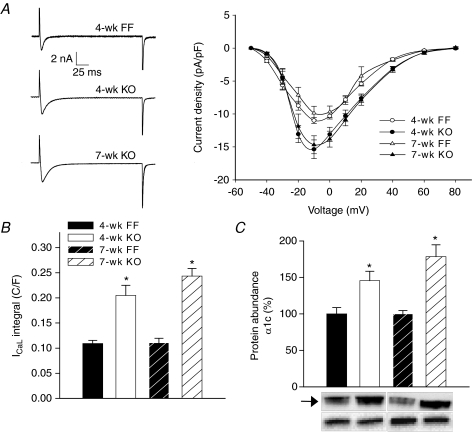
Figure 4. Increased L-type Ca2+ current in KO myocytes.
A, representative L-type Ca2+ currents recorded during a voltage step from −50 mV to −10 mV (left panel). L-type current–voltage relationship (right panel). B, integrated current measurements during the step to –10 mV. C, protein levels of the Ca2+ channel α1C subunit (arrow) vs. calsequestrin (lower bands). (n for panels A and B, and C: 4-week FF = 14, 5; 4-week KO = 12, 6; 7-week FF = 8, 6; 7-week KO = 13, 7; *P < 0.05 vs. equivalent FF).

